
Figure 2.
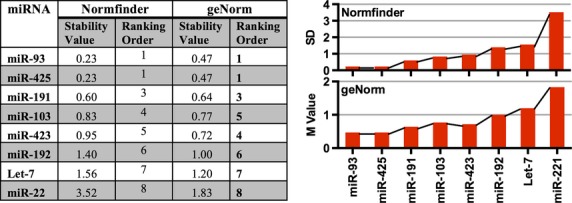
Stability values of candidate reference genes for the PRC cohort as determined by Normfinder and geNorm. Expression levels of 12 miRNAs in the plasma of newly diagnosed TB patients (n = 12) and healthy controls (n = 12) were subject to a Levene’s test to determine there was significant variance between groups. miRs -16, -26, -221 and -451 displayed significant variance between groups and were removed from subsequent analysis. The remaining 8 miRNAs were ranked by Normfinder and geNorm. Greater expression stability is indicated by a lower stability value (M). Low standard deviation (SD) values indicate stable gene expression (Normfinder).