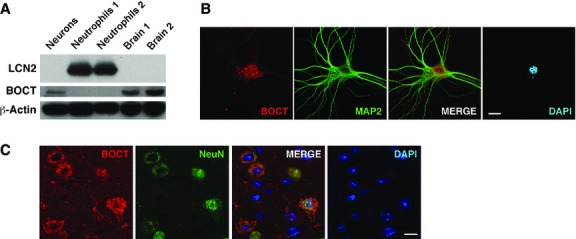
Figure 1.

Expression of LCN2 and BOCT under non-stimulated conditions. (A) A representative Western blot shows the expression of LCN2 (∽25 kD) and BOCT (∽65 kD) in cultured cortical neurons (neurons), neutrophils and brain homogenates respectively. Samples were normalized to β-Actin. Confocal images show the expression pattern of BOCT in cultured cortical neurons (B) and brain sections (C). Neurons were stained for BOCT (red) and neuronal marker MAP2 or NeuN (green). Nuclei were stained with DAPI (blue). Scale bars, 10 μm.
