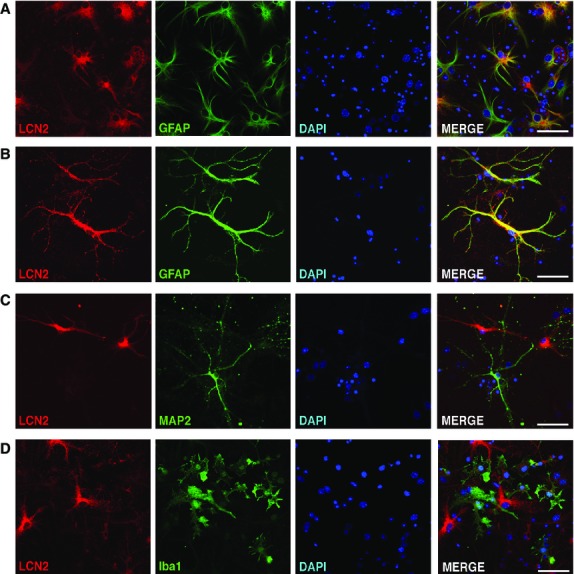
Figure 4.

Expression of LCN2 in the subset of astrocytes after the OGD. (A and B) Confocal images show the expression of LCN2 (red) and GFAP (green) in cultured cortical neurons at 23 hrs after 1 hr of OGD. Merged images indicate colocalization of LCN2 with GFAP in yellow. Images of LCN2-positive cells and MAP2-positive neurons (C) and Iba1-positive microglia (D) after the OGD demonstrating no colocalization. Scale bars, 50 μm.
