Figure 3.

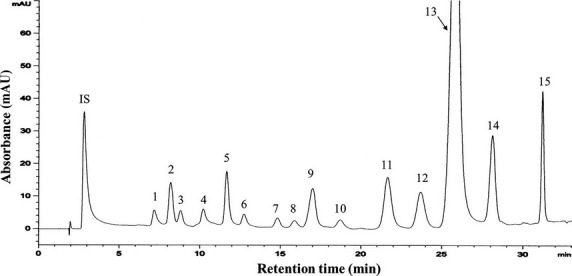
HPLC chromatogram of various chlorophylls in chlorophyll fraction from Gynostemma pentaphyllum (see Table S1 for the values of each integrated peak areas).

HPLC chromatogram of various chlorophylls in chlorophyll fraction from Gynostemma pentaphyllum (see Table S1 for the values of each integrated peak areas).