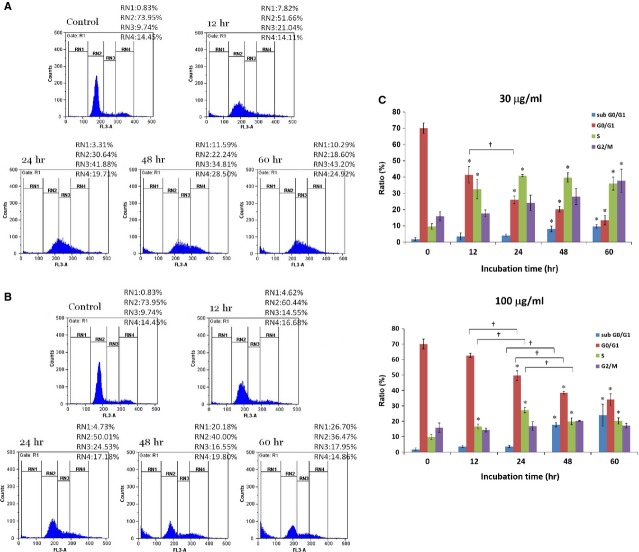
Figure 5.
Effects of 30 (A) and 100 (B) μg/ml gypenosides at indicated time intervals on cell cycles of A549 cells analysed by flow cytometry. Cell population percentages of sub-G0/G1, G0/G1, S and G2/M phases are indicated as RN1, RN2, RN3 and RN4%, respectively. Statistical analyses (C) of experimental data shown as averages with indicated standard errors (n = 3). Data with asterisks (*) and crisscross (†) indicate statistic significant (P < 0.05) as compared with control and between two groups, respectively.

