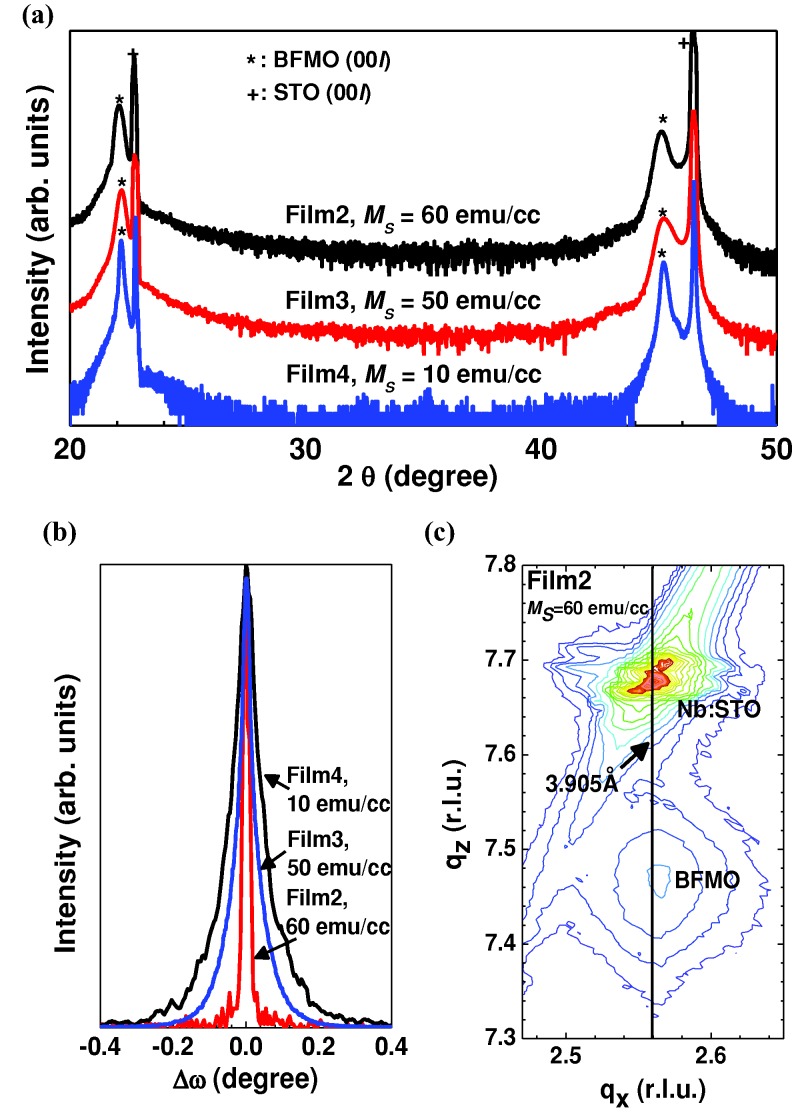
Figure 1.
Comparison of thin and thick BFMO films: a) X-ray diffraction (XRD) spectra (θ – 2θ scan) for Film 2, 3 and 4. b) ω-rocking curves of the (002) diffraction peaks of Film2 (30 nm thick), Film3 (60 nm thick) and Film4 (120 nm thick). c) Reciprocal space map (RSM) around the (103) reflections of Nb:STO of Film2.

