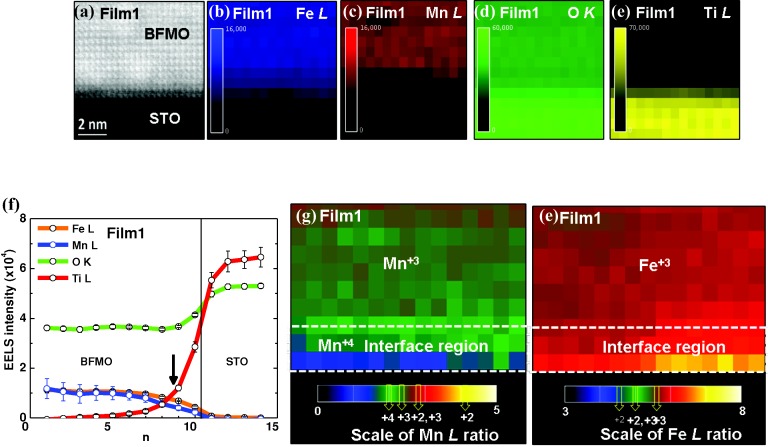
Figure 4.
Electron energy loss spectroscopy (EELS) analysis of BFMO on STO (Film1): a) ADF STEM image of the sample area for the analysis. b–e) EELS intensity distributions of Fe L, Mn L, O K, and Ti L edges, respectively. f) Averaged profiles of the respective EELS signals across the interface (marked by solid line). g,h) Valence state maps of Mn and Fe at the part of BFMO film. The maps were obtained by EELS intensity ratios of the respective Mn and Fe L edges.

