
Fig. 2.
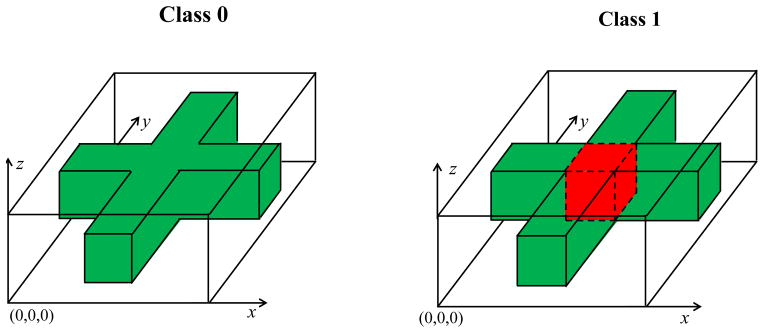
True mean images for the simulation study: Class 0 in the left panel and Class 1 in the right panel. The white, green, and red colors, respectively, correspond to 0, 1, and 2.
Official websites use .gov
A
.gov website belongs to an official
government organization in the United States.
Secure .gov websites use HTTPS
A lock (
) or https:// means you've safely
connected to the .gov website. Share sensitive
information only on official, secure websites.
True mean images for the simulation study: Class 0 in the left panel and Class 1 in the right panel. The white, green, and red colors, respectively, correspond to 0, 1, and 2.