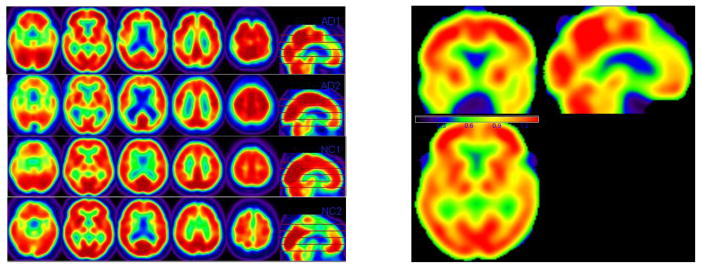
Fig. 3.

ADNI1 pet data and the important score weight matrix QI,ℓ in SWPCR. In the left panel, one row sequence of 2-D images belongs to one subject. The first two rows respectively belongs to AD subjects and the rest belongs to NC subjects. In the right panel, the three plots (left -right-bottom) are three view slices of the weight matrix QI,ℓ at the coordinate (40, 57, 26). The red region corresponds to large weight score and contains the most classification information.
