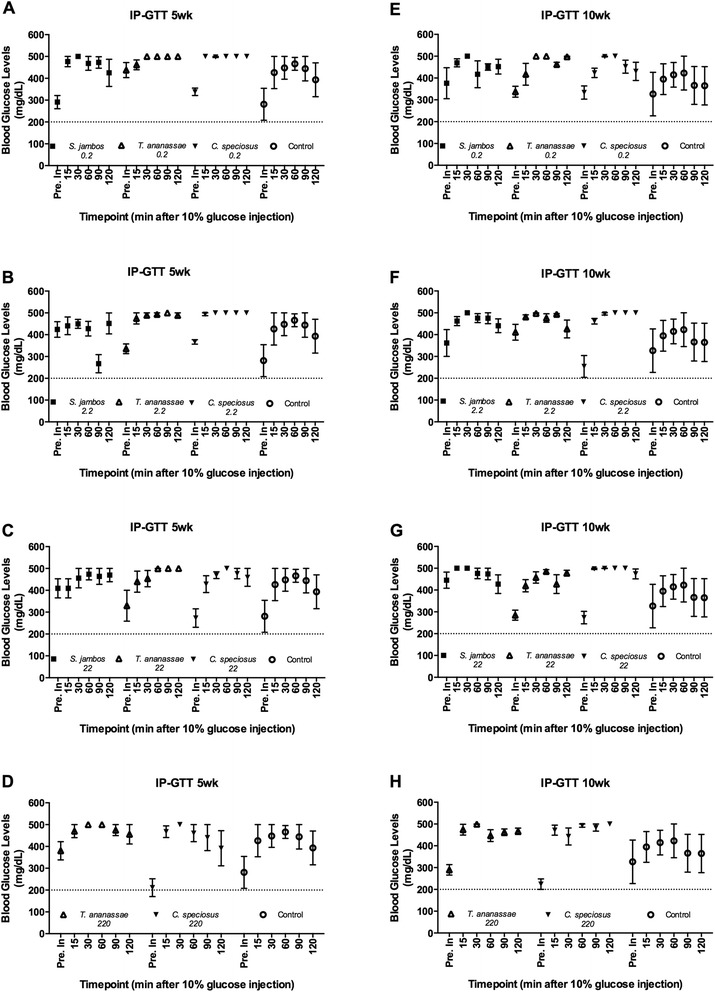
Fig. 2.

IP-Glucose Tolerance Test (IP-GTT) in the C57BLKS/J (db/db) mouse model. A-D. IP-GTT performed at 5 wks post-treatment with (a) 0.2 mg/kg_BW, (b) 2.2 mg/kg_BW, (c) 22 mg/kg_BW of S. jambos, T. ananassae, C. speciosus aqueous extracts or water (control), (d) 220 mg/kg_BW of T. ananassae, C. speciosus aqueous extracts or water (control). E-H. IP-GTT performed at 10 wks - post-treatment with (e) 0.2 mg/kg_BW, (f) 2.2 mg/kg_BW, (g) 22 mg/kg_BW of S. jambos, T. ananassae, C. speciosus aqueous extracts or water (control), (h) 220 mg/kg_BW of T. ananassae, C. speciosus aqueous extracts or water (control). Horizontal dashed line is set at 200 mg/dL. Mean values of BGL before (Pre inj.) and after 15, 30, 60, 90 and 120 min of an IP 10 % glucose solution injection. Values are means ± SEM, n = 4-5/group
