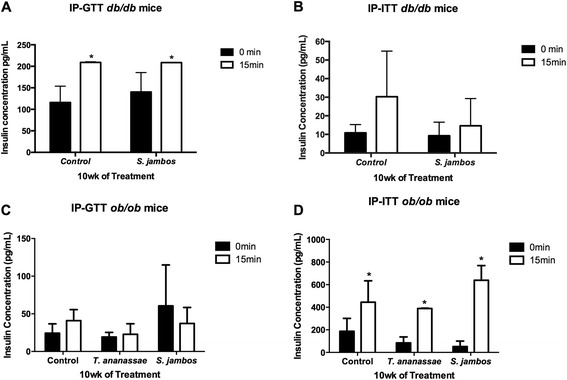
Fig. 5.

Plasma insulin levels of mice treated with plant decoctions. a Plasma insulin levels of db/db mice before (0 min) and after (15 min) a 10 % glucose injection 10 wks post-treatment with water (Control) or 2.2 mg/kg_BW S. jambos, aqueous extracts. b Plasma insulin levels of db/db mice before (0 min) and after (15 min) a 8U/g BW insulin injection 10 wks post-treatment with water (Control) or 2.2 mg/kg_BW S. jambos, aqueous extracts. c Plasma insulin levels of ob/ob mice before (0 min) and after (15 min) a 10 % glucose injection 10 wks post-treatment with water (Control) or 2.2 mg/kg_BW S. jambos or T. ananassae, aqueous extracts. d Plasma insulin levels of ob/ob mice before (0 min) and after (15 min) a 8U/g BW insulin injection 10 wks post-treatment with water (Control) or 2.2 mg/kg_BW S. jambos or T. ananassae, aqueous extracts. Columns represent means ± SEM. Differences are significant when *P < 0.05
