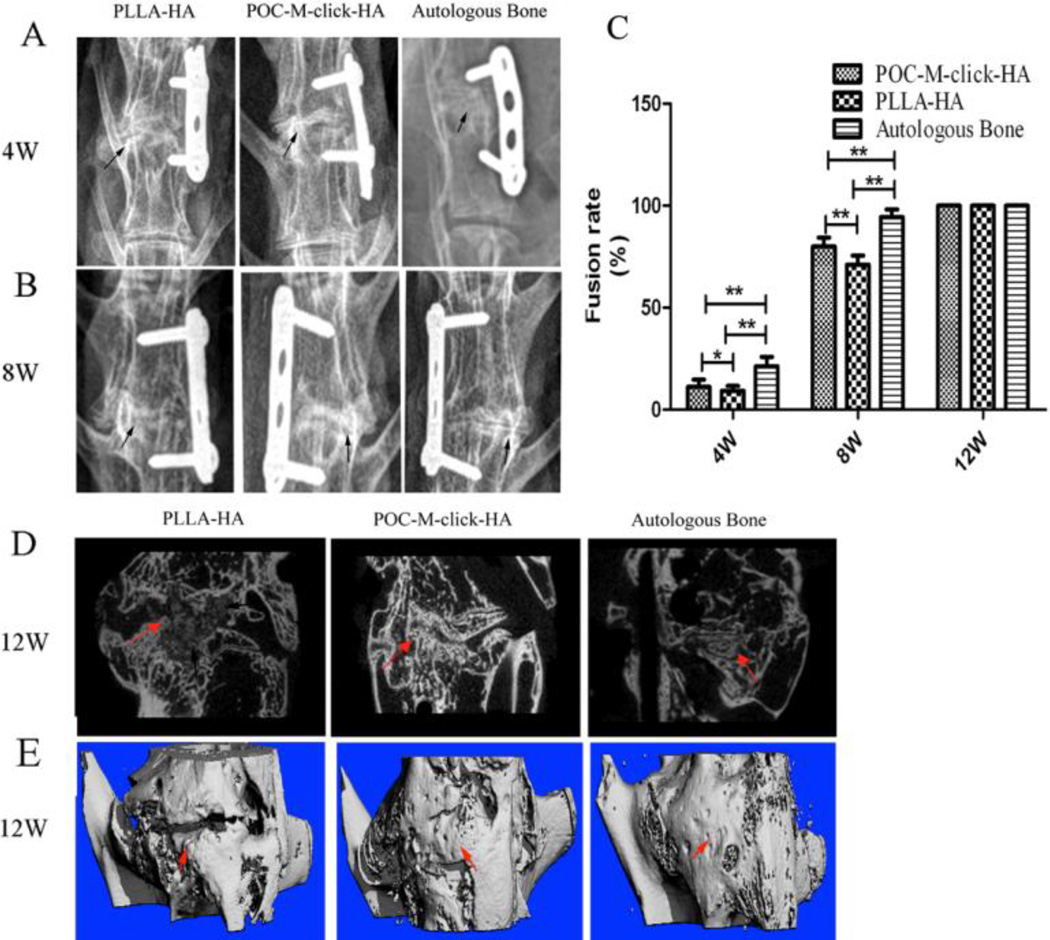
Figure 5.
Radiography observation of spinal fusion. (A and B) Representative X-ray images of specimens at 4 and 8 weeks after surgery. Black arrows indicate the fusion segment. (C) Fusion rate at 4, 8, and 12 weeks (**p<0.05, *p>0.05). (D) Representative micro-CT scan along the sagittal plane and (E) Three-dimensional reconstruction of a specimen after 12 weeks of surgery with new bone indicated by red arrows.

