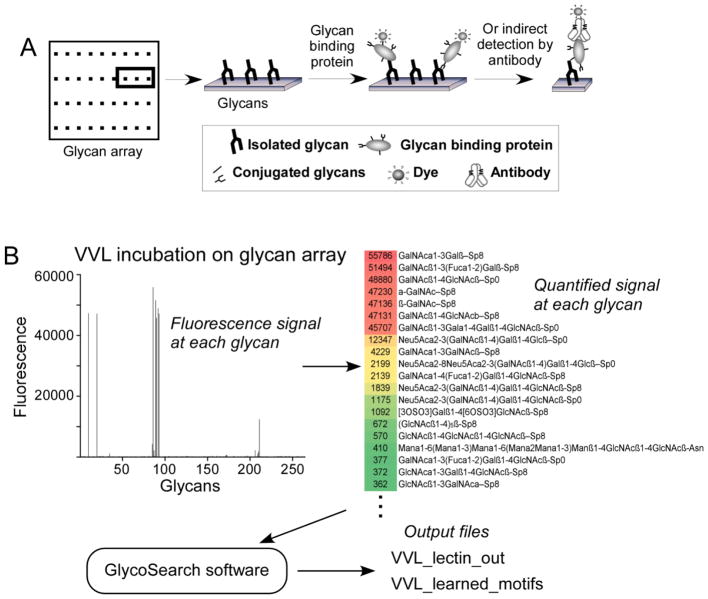
Figure 1. Glycan array data processing.
(A) Glycan arrays consist of purified glycans immobilized in discreet locations on slides. A glycan-binding protein is incubated on the slide to allow binding to any glycans. The amount of bound protein at each glycan spot is determined through measuring fluorescence from a tag on the glycan-binding protein or on a secondary detection reagent. (B) The fluorescence signals from the binding of the lectin vicia villosa (VVL) to 215 different glycans were quantified (left panel) and placed in an Excel file containing the names of the glycans and the corresponding signals (right panel), which served as the input for the GlycoSearch software. The software outputs two files: an Excel file containing the main analysis, and a text file providing details of the motif refinement by combination motifs.

