
Figure 3.
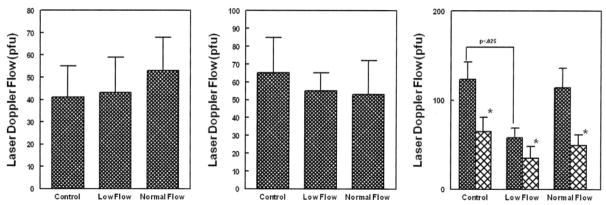
Response to additional α-adrenergic agonists and antagonists. Left panel shows the maximal LDF with bretylium; middle, maximum LDF response to phentolamine; right, response to preheating (dark bars) followed by tyramine (lighter bars). The only significant difference is a decrease in the pretyramine heating response in low-flow POTS. *P<0.05 difference from baseline for each group.