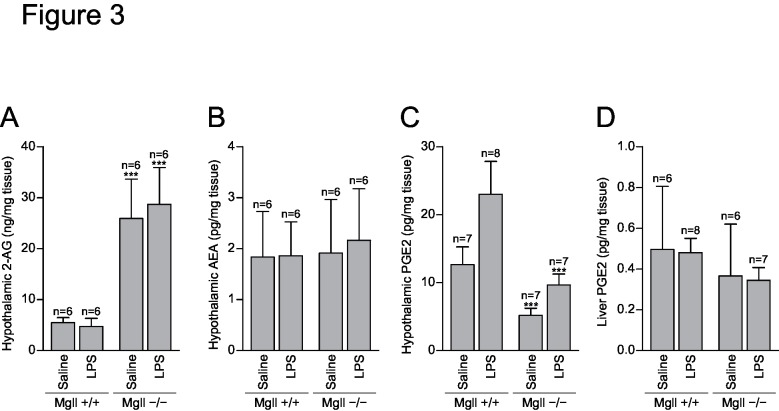
Fig 3. Lipid mediator levels after LPS administration.
Mgll +/+ and Mgll −/− mice were intraperitoneally injected with 20 μg of LPS or saline (n = 6–8 for each group). Two hours later, hypothalamus and liver tissues were collected. Lipids were extracted and analyzed by liquid chromatography-tandem mass spectrometry. (A) Hypothalamic 2-AG levels. (B) Hypothalamic anandamide levels. (C) Hypothalamic PGE2 levels. (D) Liver PGE2 levels. Data are expressed as means ± SD. ***p<0.001 vs. Mgll +/+, by Bonferroni post-test after two-way ANOVA.

