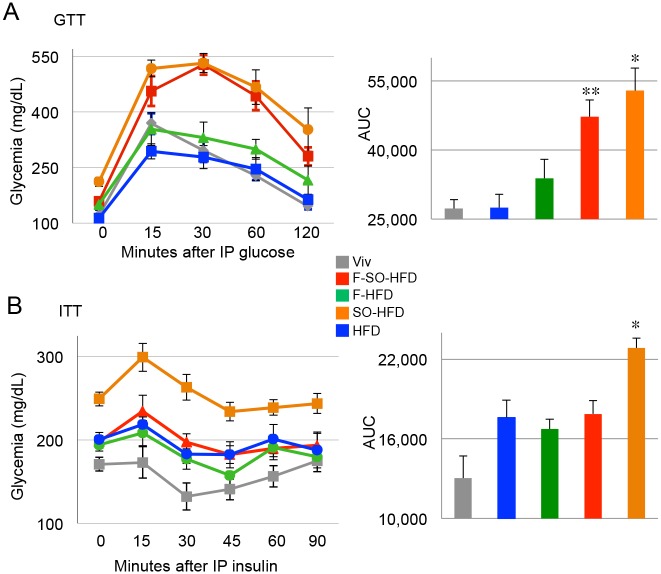
Fig 4. Soybean oil induces diabetes and insulin resistance (IR).
A) Left panel: GTT assay of male mice on the indicated diets for 20 weeks. Right panel: Area under the curve (AUC) for GTT. * SO-HFD significantly higher than HFD, F-HFD and Viv. ** F-SO-HFD significantly higher than Viv and HFD. B) Left panel: ITT assay of mice on the indicated diets for 33 weeks. Right panel: Area under the curve (AUC) for ITT. * SO-HFD significantly higher than others. Significance is defined as P ≤ 0.05 by ANOVA with Tukey’s post-hoc analysis. N = 6–12 per group.

