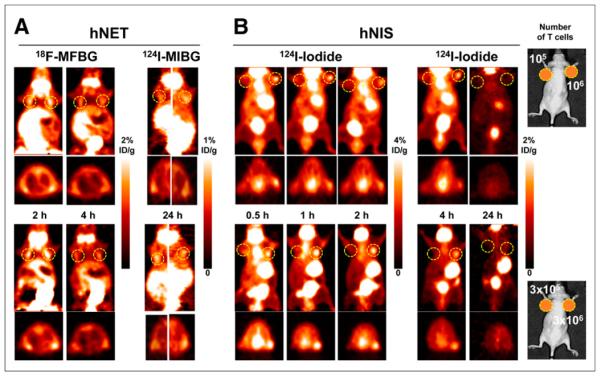
FIGURE 2.
PET imaging of human primary T cells transduced with hNET (A) or hNIS (B) reporters. Different numbers of T cells were injected subcutaneously, followed by systemic administration of corresponding radiopharmaceuticals and PET imaging at respective time points. Number of T cells injected is shown in right upper and lower panels. %ID/g 5 percentage injected dose per gram.

