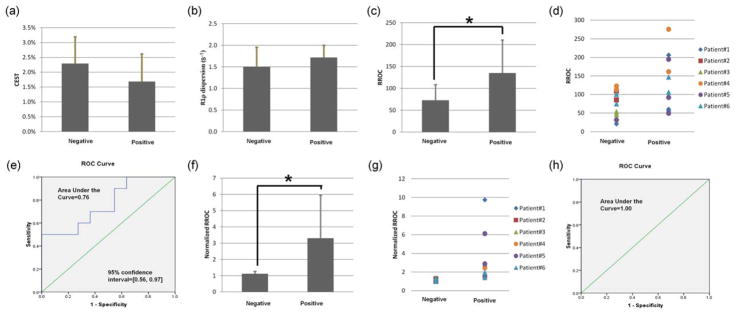
FIG. 5.

Patient results. a,b: –OH CEST and R1ρ dispersion values for positive and negative discs, respectively. c,f: the difference in RROC and normalized RROC between positive and negative discs, respectively. d,g: RROC and normalized RROC of individual discs, respectively. e,h: ROC curves for RROC and normalized RROC, respectively. Stars indicate significant difference by paired t-test (P < 0.05).
