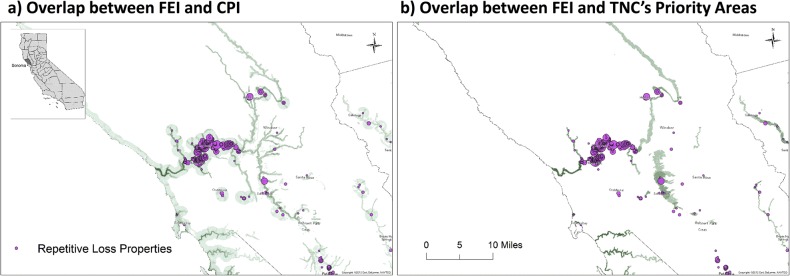
Fig 4. RLPs in Sonoma County and a) overlap between the FEI and CPI; b) overlap between the FEI and TNC’s Priority Areas.

Darker green indicates areas where higher indices values overlap. Fuchsia circles represent the locations of RLPs (as of April 2010). The size of the circles represent the total number of flood claims filed (from 2 to 9) by each RLP.
