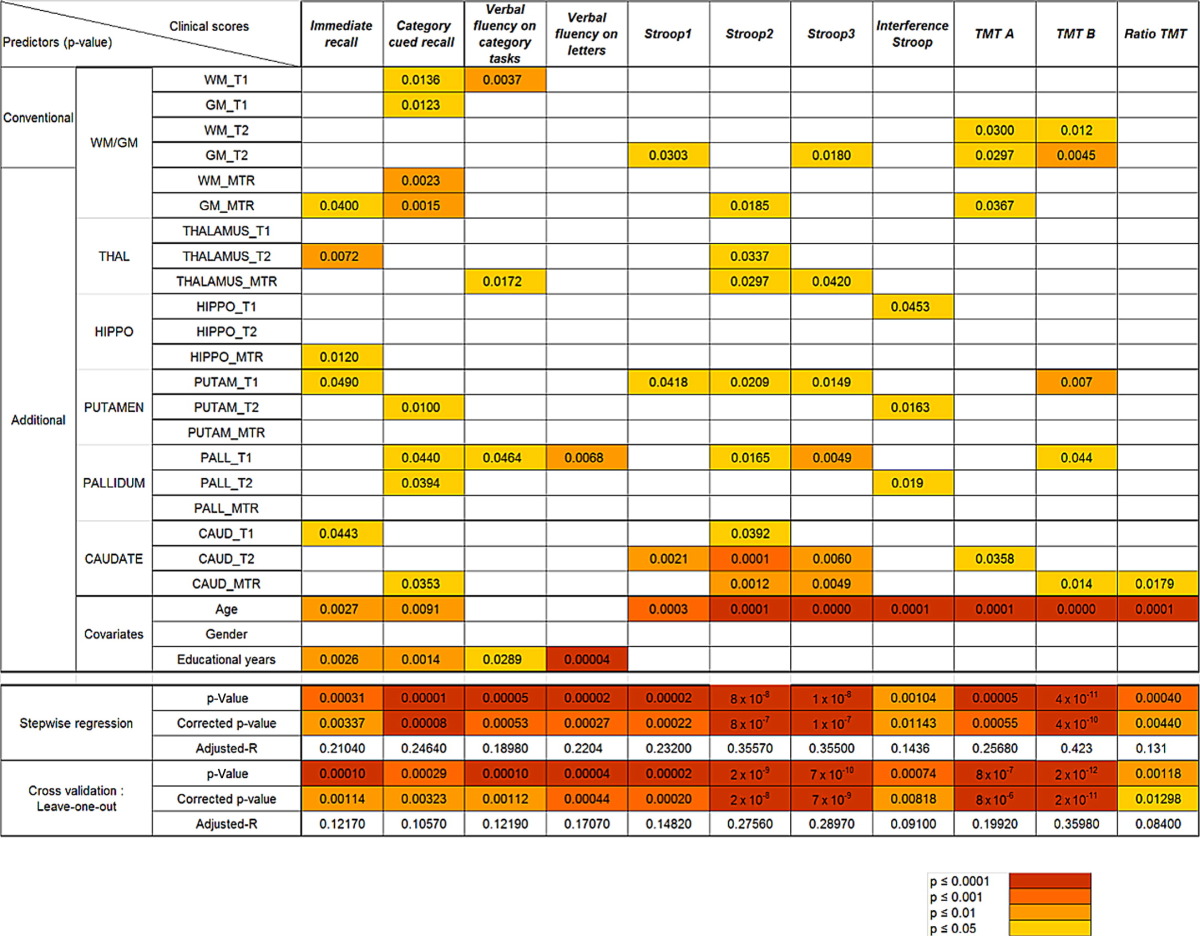
Table 3.
Multiple regression analysis performed using a generalized linear model between MRI characteristics, covariates, and clinical scores in patients. Top part: Each line corresponds to the p-values of each predictor for every regression model performed. Bottom part: Each line corresponds to the p-values, corrected p-values, and adjusted-R of each model (n = 11) subjected to regression, cross-validation analysis and correction for multiple comparison.The colour scheme signifies the difference in significance: Dark orange p ≤ 0.0001, light orange p ≤ 0.001, yellow p ≤ 0.01, light yellow p ≤ 0.05.