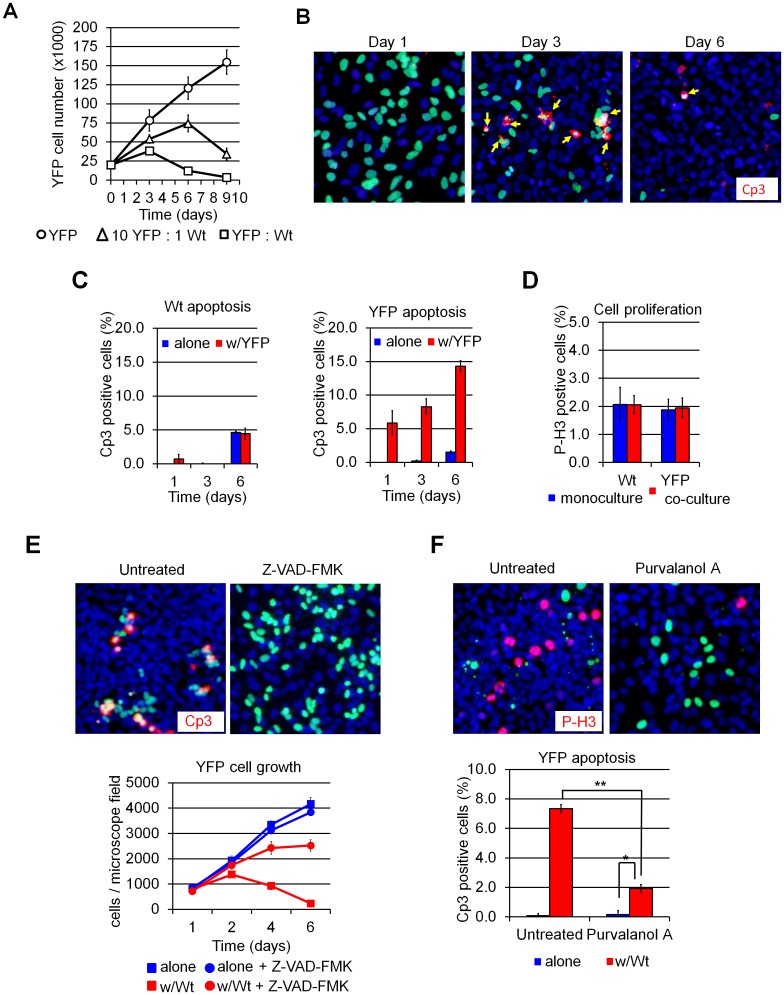
Fig 1. Cell death is triggered by a cell competition-like interaction in clonally-derived mammalian cell lines.
(A) Cell counts showing YFP (“loser” cells) cells first expand, then decline, in the presence of Wt (“winner”) cells but grow unimpeded when cultured alone. Time is measured from cell seeding (t = 0). (B) Cleaved caspase-3 (Cp3) immuno-fluorescence (IF) (red) of U2OS cultures showing increased apoptosis in co-cultured YFP cells (green). Arrows indicate Cp3+ apoptotic YFP cells. Wt cells are counterstained with Hoescht 33342 (blue). (C) Quantification of apoptosis on immune-stained cultures; x-axis, time in days (d) Note that the baseline level of apoptosis increases with cell density by day 6 under all culture conditions. (D) Quantification of cell proliferation in 72-hour U2Os cultures by phospho-histone H3 (PH3) immunofluorescence. (E) Cp3 IF of 72-hour U2OS cultures treated with the caspase-3 inhibitor Z-VAD-FMK. YFP cell counts per microscope field are shown at the bottom. Inhibition of apoptosis by Z-VAD-FM K prevents YFP elimination from Wt:YFP co-cultures. (F) P-H3 IF of U2OS cells cultured for 72 hours in presence of the Cyclin D1 inhibitor purvalanol A as indicated. Quantification of apoptosis is shown below. Purvalanol A treatment inhibits proliferation (top) and rescues YFP elimination (bottom). Images were taken at 100X magnification. Error bars in this and all subsequent figures reflect mean ± SD. *: p<0.05, **: p<0.01 and ***: p<0.001 by Student’s t-test.

