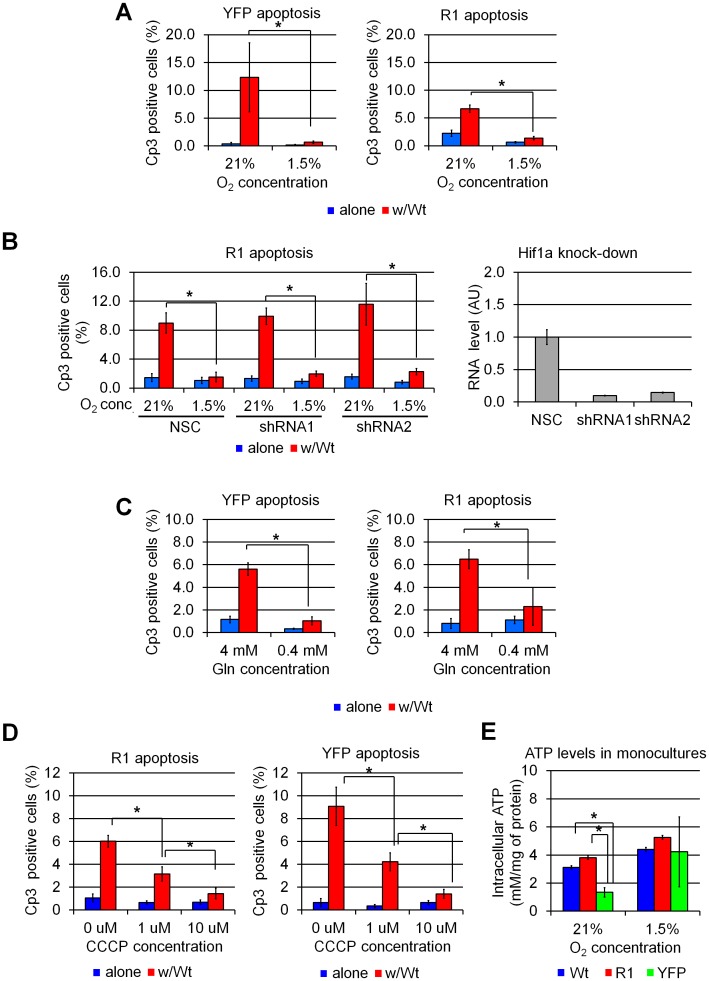
Fig 5. Differences in energy metabolism drive cell competition in mammalian cells.
(A) Quantification of apoptosis (Cp3 immunofluorescence) in U2OS cultures grown for 72 hours under normoxic (21% O2) or hypoxic (1.5% O2) conditions. Hypoxia inhibits cell competition-induced elimination of YFP and R1 cells in Wt:YFP and Wt:R1 co-cultures. (B) Quantification of Cp3 immunofluorescence in U2OS R1 cells expressing a nonsense (NSC, non-silencing control) shRNA or shRNAs directed against the Hif1a transcription factor. Hif1a knockdown in loser cells does not affect cell competition. qPCR analysis of Hif1a in shRNA-expressing YFP cells is shown on the right. (C) Quantification of Cp3 immunofluorescence in U2OS cultures grown for 72 hours in medium containing standard (4 mM) and reduced (0.4 mM) Glutamin (Gln) concentrations. Withholding Gln arrests cell competition in U2OS cells. (D) Quantification of Cp3 immunofluorescence in U2OS cultures treated with a mitochondrial uncoupling agent (carbonyl cyanide m-chlorophenyl hydrazine, CCCP). Uncoupling respiration from oxidative phosphorylation blocks competition-induced elimination of R1 and YFP cells, indicating that competition is driven by differences in the activity of ATP-generating pathways. (E) Luciferase analysis of intracellular ATP levels in monocultured U2OS cell. YFP, but not R1 cells, display reduced ATP levels in when compared to Wt cells. Hypoxia increases ATP levels YFP cells, suggesting that reduced ATP levels may reflect or underlie YFP cell fitness.*: p<0.001, by one-way ANOVA.

