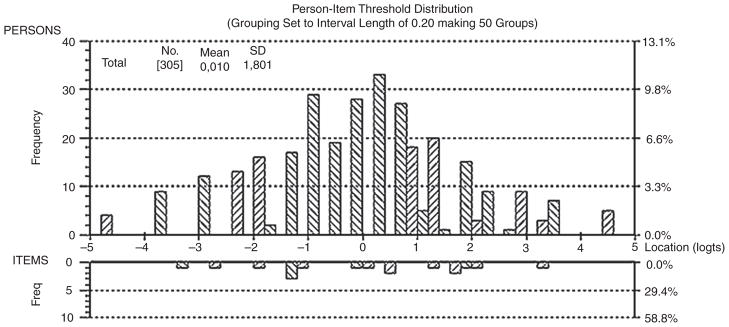
Figure 1.

Person-Item distribution of the sample with the final 17 items. Interpretation of the figure: The horizontal line represents the latent trait ‘functioning’ according to the International Classification of Functioning, Disability and Health. The value of −3 means that a patient with a score result on the left side of the continuum has no major limitation in functioning. The lower the score, the better the ‘functioning’.
