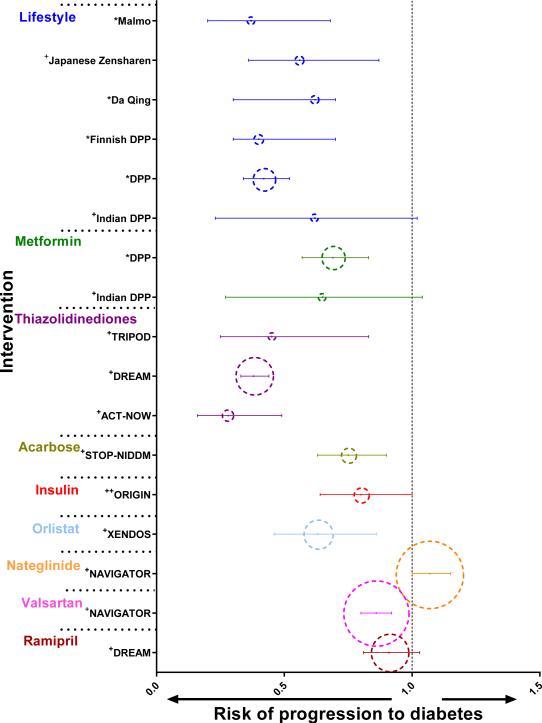
Figure 1. Risk of progression to diabetes compared to controls for various interventions that have been tested for diabetes prevention.
This figure illustrates the risk of progression to diabetes compared to controls with corresponding 95% confidence intervals of various studies grouped by intervention. * denotes relative risk ratio; + denotes hazard ratio; ++ denotes odds ratio. In each group, the studies are listed in chronological order according to the years in which the original interventions were conducted. The dotted circles for each study have been scaled to be proportional to the sample size of the study.

