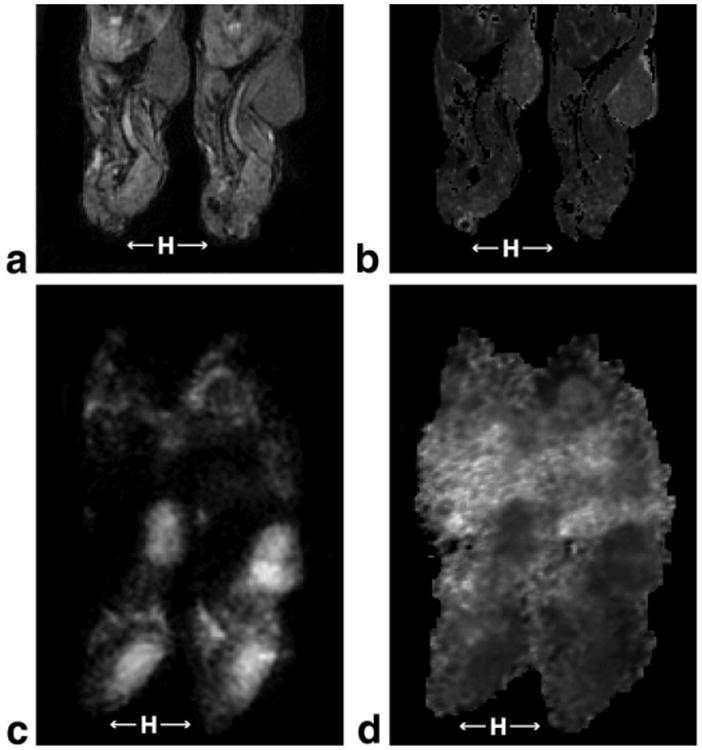
Figure 3.

Representative MR images. a: A representative T1-weighted image for a pair of mice acquired at flip angle 40°. Mice head (H) are indicated with arrows for orientation. b: The corresponding T1 map generated from T1-weighted images acquired at flip angles of 40°, 20°, and 8°. c: A representative diffusion-weighted image (b-value = 603 s/mm2). Mice head (H) are indicated with arrows for orientation. d: The corresponding ADC map.
