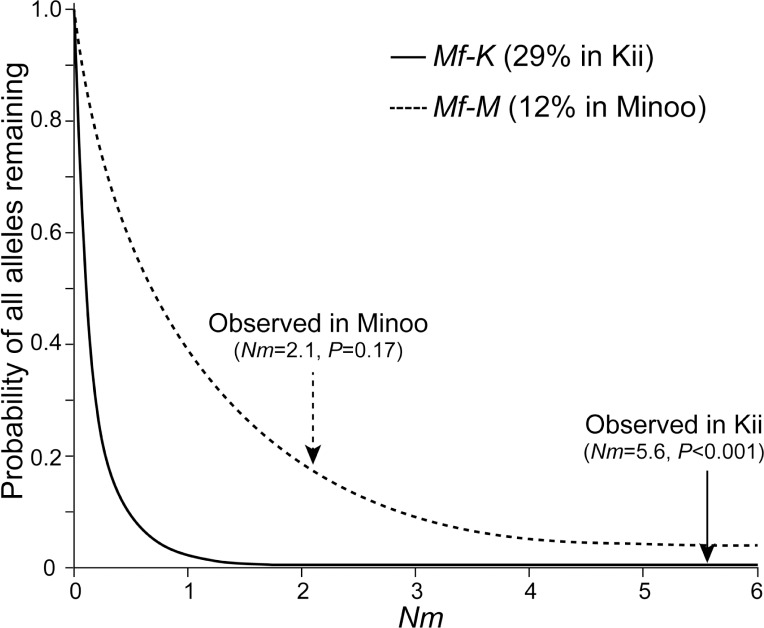
Fig 7. Computer simulations for migration among populations.
The horizontal axis indicates the Nm value used as an index of the migration level. Graphs indicate the probability that all alleles remain in each population during expansion to each frequency with 1000 replications. A value of 0 indicated that all alleles migrated to other populations. Straight and dashed lines indicate Mf-K alleles in the Kii population and Mf-M alleles in the Minoo population, respectively, with each Nm value estimated from a non-coding region (Table 3) indicated by arrows.

