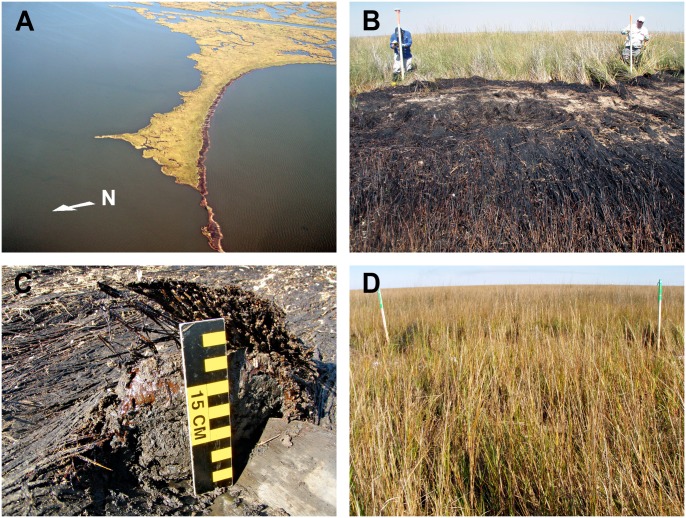
Fig 2. Pre-treatment oiling conditions.
(A) Aerial view of heavy oiling distribution during plot set-up and adjacent reference area (shoreline at top right), (B) heavily oiled vegetation mat at plot-scale, (C) test pit depicting thick layer of emulsified oil (orange) on the marsh surface below the oiled vegetation mat, (D) reference plot for comparison.

