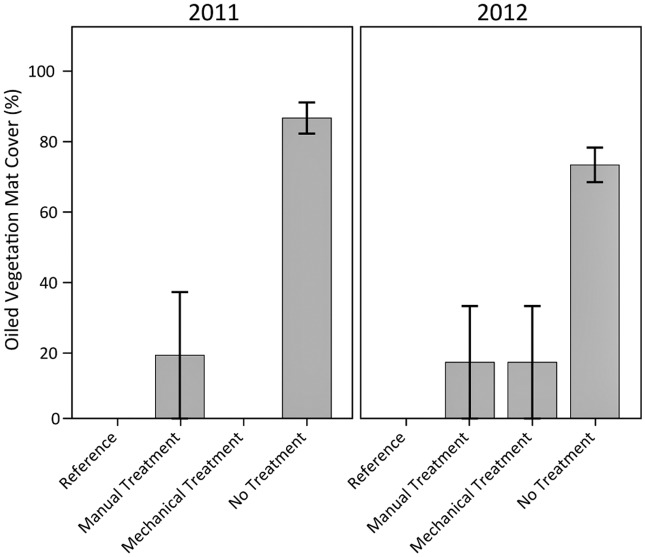
Fig 3. Oiled vegetation mat cover in 2011 and 2012.
Differences among oiling/treatment classes were observed (p < 0.01); differences were not observed among years (p = 0.97); and potential differences were observed for the interaction of oiling/treatment class and year (p = 0.06). Specific oiling/treatment class differences were observed for no treatment versus all other classes (all p < 0.01). Data are means ± 1 standard error (SE). N = 9 for the heavily oiled plots with no treatment; n = 5 for all other oiling/treatment classes including reference.

