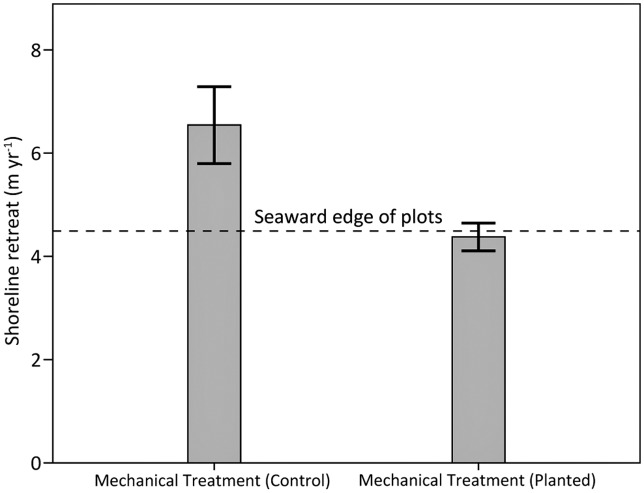
Fig 15. Marsh shoreline retreat among planted and control (unplanted) plots in mechanically treated areas in 2012.
Differences were observed for planted versus controls (p = 0.03). Data are means ± 1 SE. The dashed line represents the position of the seaward edge of the plots, which was also the seaward edge of vegetation in the planted plots. N = 5 for both planted and control plots.

