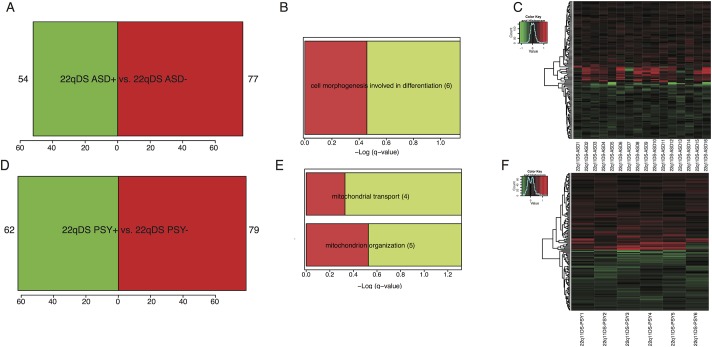
Fig 3. Differential expression (DE) analysis comparing phenotypic expression (i.e., psychosis, autism spectrum disorders) within the 22q11DS sample.
A. Number of DE genes at p<0.005 for 22q11DS participants with ASD (N = 16) vs. 22q11DS without ASD (N = 34). One hundred thirty one probes (54 down-regulated, 77 up-regulated) were DE in 22q11DS patients with ASD in comparison to 22q11DS patients without ASD. B) Gene ontology analysis (q≤.05) of DE genes in 22q11DS with ASD vs. 22q11DS without ASD. The top category was associated with cell morphogenesis involved in differentiation. Bars represent the–Log of the over-representation q-value, as calculated by the DAVID algorithm (http://david.abcc.ncifcrf.gov/). Red and green represent the proportion of up and down-regulated genes, respectively. C) Heatmap depicting fold changes in peripheral blood samples for each 22q11DS participant with ASD. Genes are in rows, and samples are in columns. Shades of red indicate up-regulation compared to the 22q11DS participants without ASD, shades of green indicate down-regulation. D) Number of DE genes at p<0.005 for 22q11DS with a psychotic disorder (N = 6) vs. 22q11DS participants without a psychotic disorder (N = 40). One hundred forty one probes (62 down-regulated, 79 up-regulated) were DE in 22q11DS with psychosis in comparison to 22q11DS patients without psychosis. E) Gene ontology analysis (q≤.05) of DE genes in 22q11DS with psychosis vs. 22q11DS without psychosis. Top categories were associated with mitochondrial transport and organization. Bars represent the–Log of the over-representation q-value. Red and green represent the proportion of up and down-regulated genes, respectively. F) Heat map depicting fold changes in peripheral blood samples for each 22q11DS participant with psychosis. Genes are in rows, and samples are in columns. Shades of red indicate up-regulation compared to the 22q11DS participants without psychosis, shades of green indicate down-regulation.

