
Figure 2.
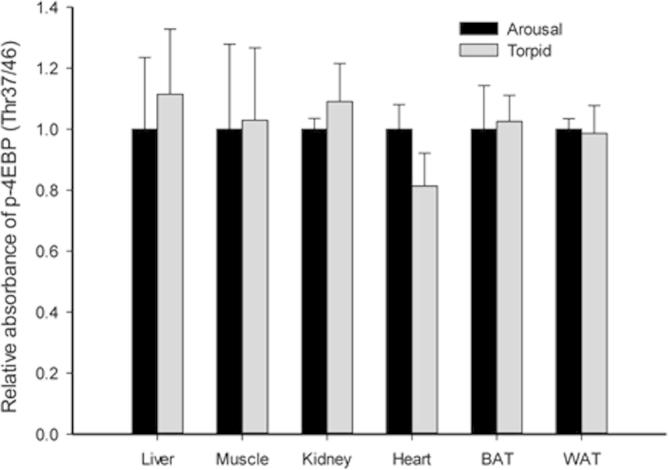
Response of p-4EBP (Thr37/46) to daily torpor in various lemur tissues
Histograms show relative absorbance based on antibody binding to the phosphoprotein target under control (aroused) and torpid states. Data are presented as mean ± SEM (n = 3–4 independent trials on tissue from different animals). *Denotes significant difference from the corresponding control by the Student’s t-test (P < 0.05).