
Figure 4.
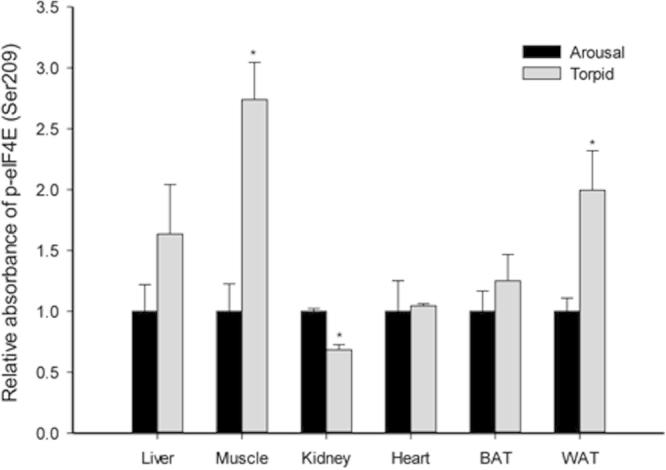
Response of p-eIF4E (Ser209) to daily torpor in various lemur tissues
Histograms show relative absorbance based on antibody binding to the phosphoprotein target under control (aroused) and torpid states. Data are presented as mean ± SEM (n = 3–4 independent trials on tissue from different animals). *Denotes significant difference from the corresponding control by the Student’s t-test (P < 0.05).