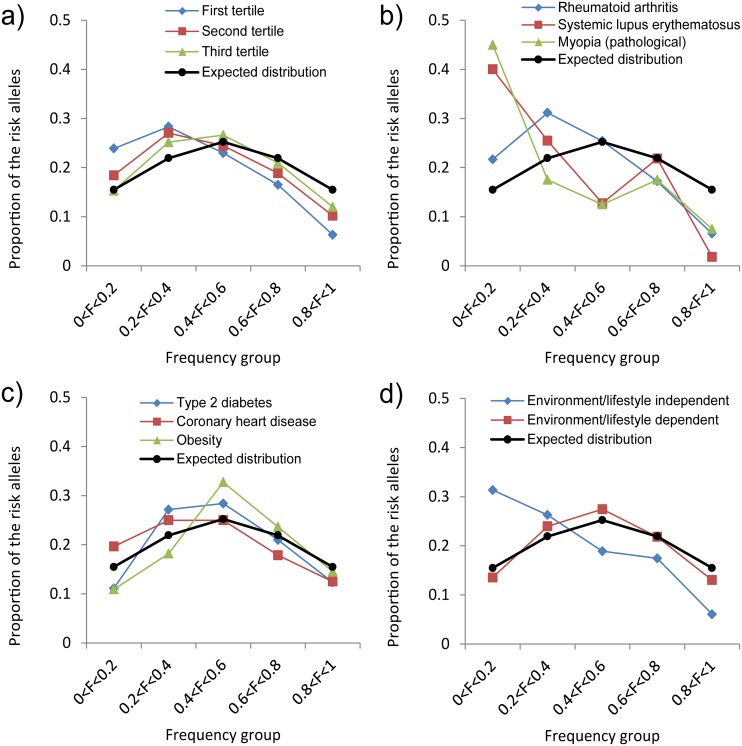
Fig 3. Frequency binned distributions of the risk alleles for different common diseases.
F—frequency of the risk-associated allele. Area under each curve equals 1. Black line shows the distribution expected under the assumption that the probability of the allele to be risk associated is independent of its frequency. a) Proportions of the risk alleles in the 5 frequency categories for diseases stratified by the ELI tertiles. b) Proportions of the risk alleles for 3 individual diseases from the first tertile (environment/lifestyle independent diseases). c) Distributions of risk alleles for 3 individual diseases from the third ELI tertile (environment/lifestyle dependent diseases). d) Proportions of the risk alleles averaged for the 3 environment/lifestyle dependent (red line) and 3 environment/lifestyle independent (blue line) diseases.

