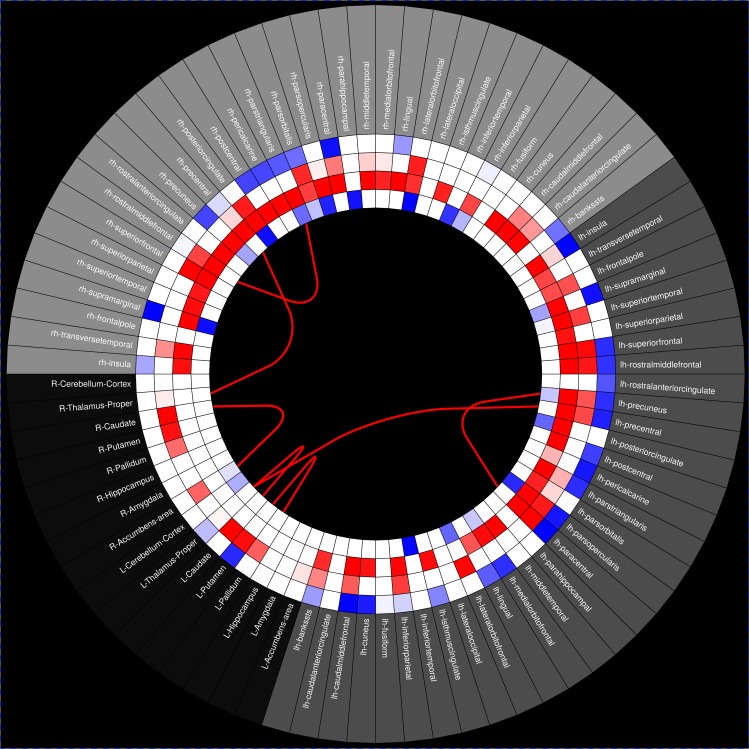
Figure 10. Statistical test connectogram between younger and older subjects.
From the outer to the inner rings: Regions-of-Interest (ROIs), mean diffusivity, ROI volume, cortical thickness, fmri degree. The lines represent tract connections between brain regions. Blue and red colors, respectively, represent increased and decreased metrics’ mean values or number of tracts in older subjects group vs. youger subjects group.

