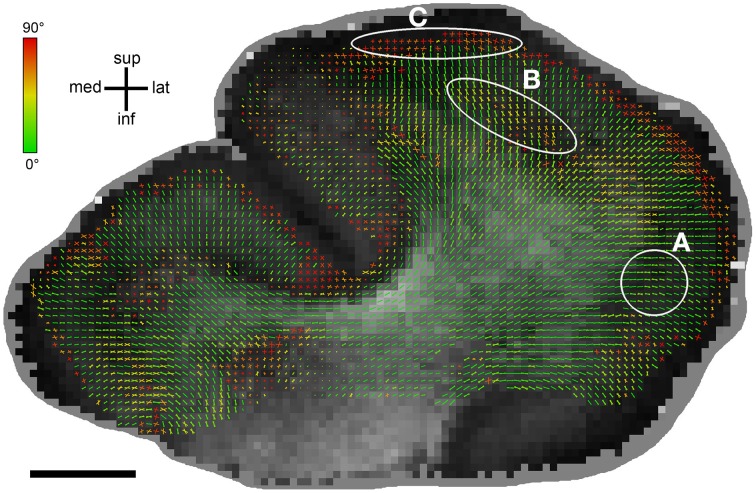
Figure 6.
Differences between MRIDT and HistST orientations displayed on an FA map. MRIDT and HistST orientations are plotted in a color range from green (for orientations that perfectly agree) to red (for orientations that differ by 90°). Bar length reflects the projection length of the diffusion tensor in the sectioning plane. There is a generally good histology-DTI agreement for high FA values, especially in white matter. For lower FA, particularly when entering gray matter, there are three cases: (A) Good agreement in case of predominant radial orientations, (B) Moderate to weak agreement, (C) Perpendicular histology-DT orientedness. Here, voxels are located well within gray matter and run in bands parallel to the cortical surface. Scale bar: 5 mm.

