Figure 3.
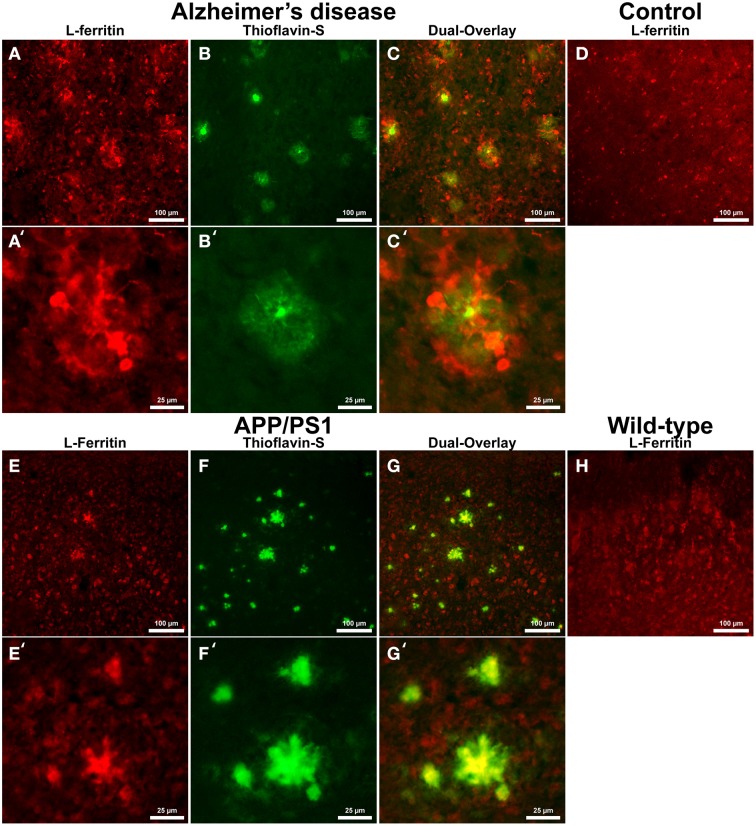
Light ferritin antibody (red, A,E) and thioflavin-S (green, B,F) staining for amyloid-β plaques in AD (A–C), APP/PS1 (E–G), control human (D) and control mouse (H) tissue at 100x (A–H) and 400x (A′–C′,E′–G′) magnification. L-ferritin staining in the AD tissue samples shows intracellular staining in cells surrounding amyloid plaques and throughout the imaging field. The cellular morphology of the L-Ferritin positive cells in the AD tissue is identical to the cells stained for IBA-1 (see Figure 1 for comparison). Human control tissue (D) L-ferritin reactivity is found in small round oligodendrocyte cells throughout the cortex with some microglial staining consistent with aged human gray matter. L-ferritin staining in the APP/PS1 tissue shows intracellular staining of cells inside plaques and oligodendrocytes in the granular layer of the cortex which. In contrast to the AD tissue, there is no positive staining of cells surrounding amyloid plaques in the APP/PS1 tissue samples. Mouse control tissue (H) demonstrates intracellular L-ferritin reactivity in oligodendrocyte cells, similar to the background oligodendrocyte staining in the APP/PS1 tissue. The scale bars are set to 100 and 25 μm in length.

