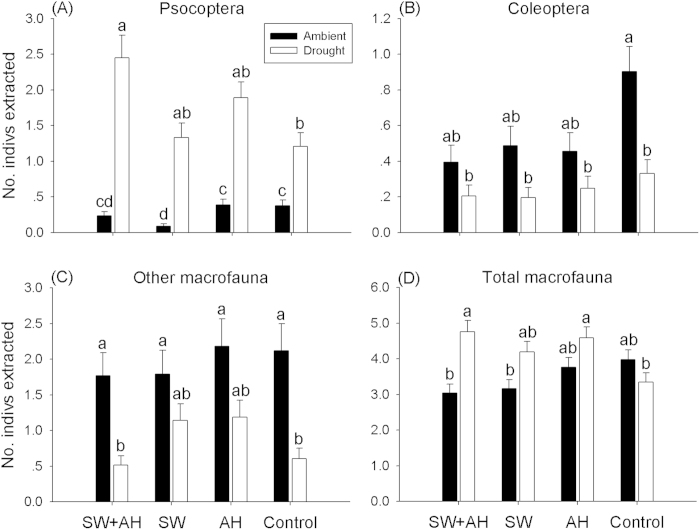
Figure 2. Effects of different spider treatments on the abundance of main groups of macrofauna under ambient and drought conditions.
A) Psocoptera, B) Coleoptera, C) Other Macrofauna, and D) Total Macrofauna. Data are expressed as mean ± s.e.m (n = 10). Means with different letters are significantly different (P < 0.05). Note that y-axes have different scales.

