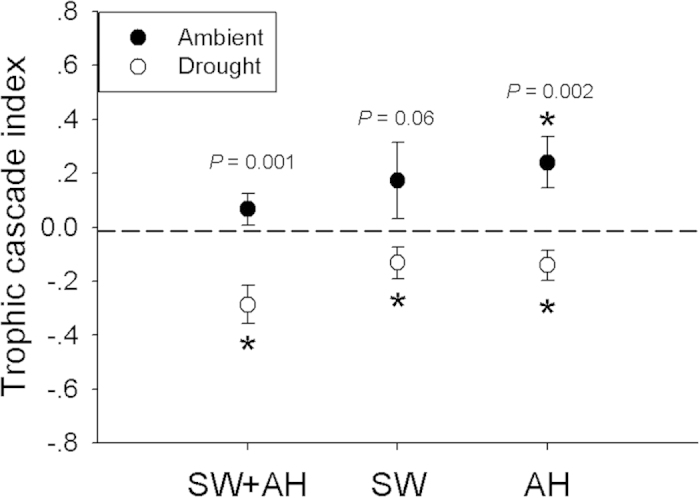
Figure 3. Effects of spider-induced trophic cascade on leaf litter decomposition rate expressed as trophic cascade index under ambient and drought condition.

A value of trophic cascade index above the dotted line (zero) indicates positive effects of treatments on litter decomposition, near the dotted line (zero) indicates the absence of trophic cascade, and below the dotted line (zero) indicates negative effects of treatments on litter decomposition. Asterisks indicate significance differences between index and dotted line (zero) (P < 0.05, Bonferroni-corrected). Data are expressed as mean ± s.e.m (n = 10). The P value indicate the differences of trophic cascade index between ambient and drought conditions.
