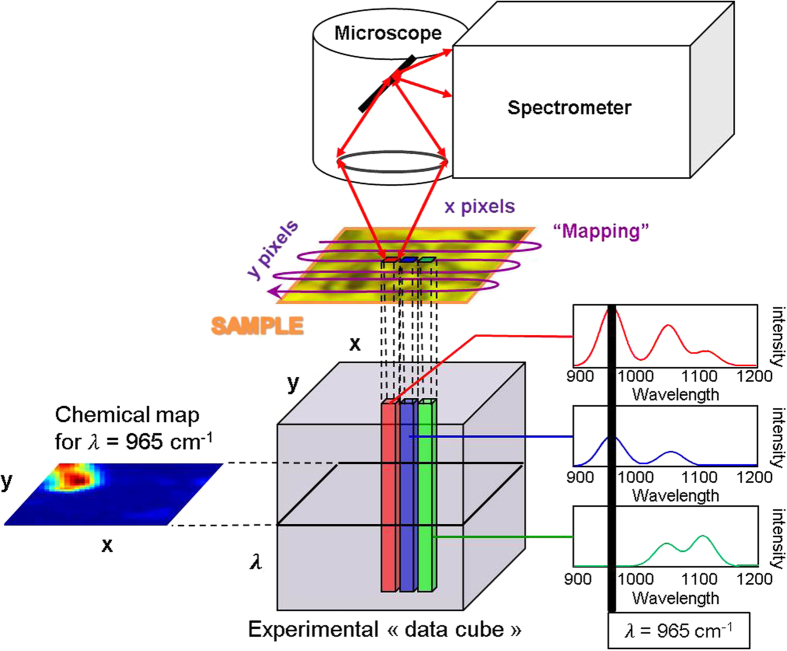
Figure 1. Hyperspectral imaging.
A “mapping” in the x and y directions is used to acquire the experimental data cube (x pixels × y pixels × λ). As a consequence, each pixel has a spectrum. If we know, for example, that the λ = 965 cm−1 is a specific wavelength of the compound of interest, it is then possible to integrate the signal for each pixel to generate its corresponding chemical map.

