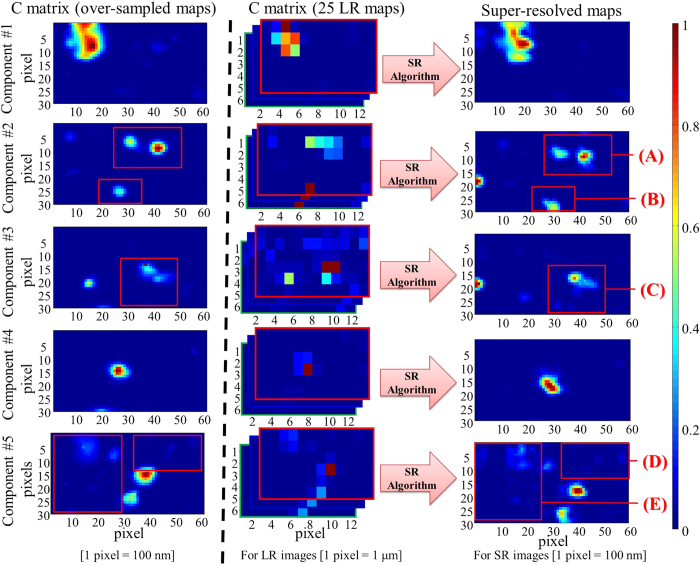
Figure 5. Comparison of the distribution maps obtained from MCR-ALS analysis of over-sampled images (left plots), MCR-ALS multiset image analysis of the low-resolution images (center plots), and the super-resolution images (right plots).
The component #1 is much better described on the super-resolution image. The edges and the shape of the aerosol aggregates are better defined. It is also observed for area (A) and (B) on the component #2. This is even more evident on the component #4. A single particle is detected on the over-sampled map while two stuck particles seem to be observed on the super-resolution image. Some new aggregates can even be observed on the component #3 (C) or on the component #5 (D) and (E) for the super-resolution images that are impossible to observe on the over-sampled images.

