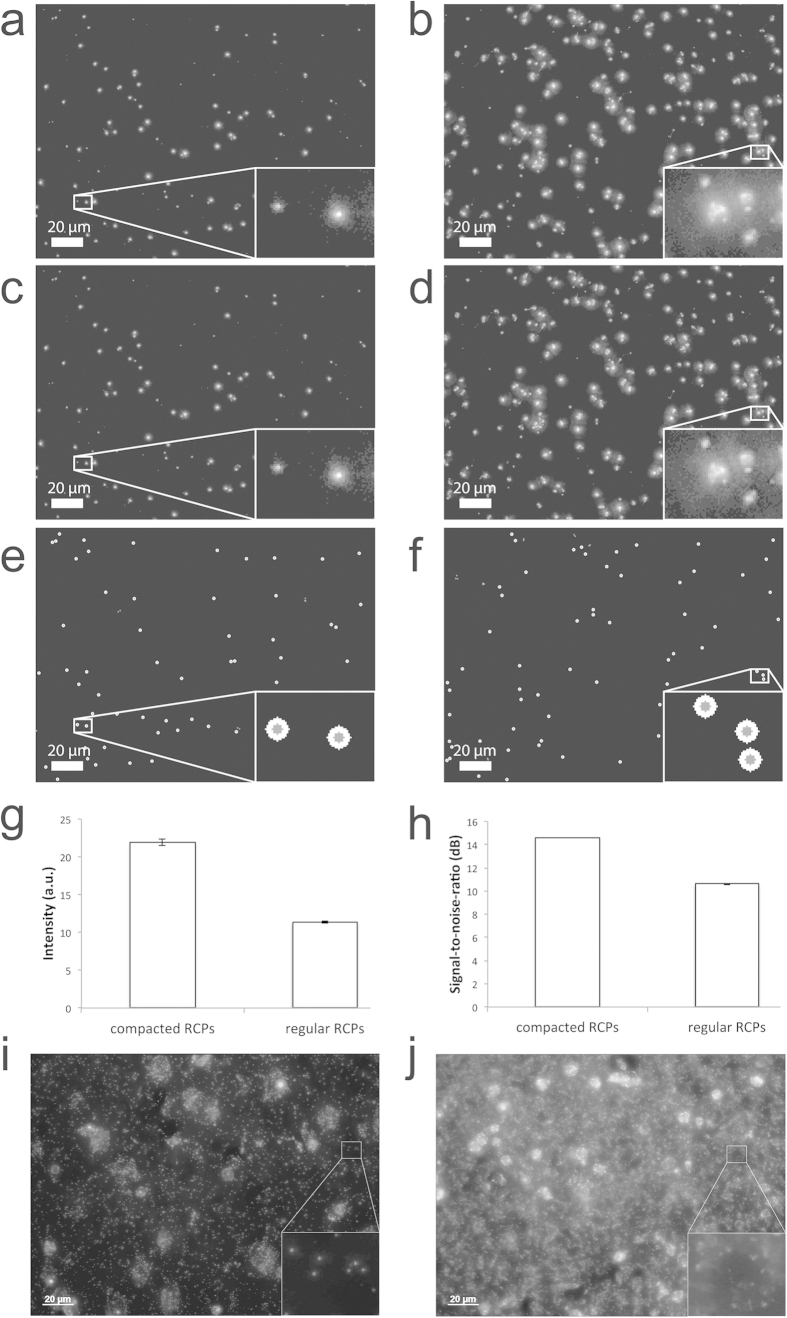
Figure 2.
Comparison of signal intensity and SNR of regular vs. compacted RCPs. Compacted RCPs (a, c, e) are compared to regular RCPs (b, d, f) throughout steps in the image analysis procedure. Maximum projections of the z-stacks (a, b) are background corrected (c, d) before segmentation of signals (e, f). The detected signals are shown as gray disks and the signals used for signal-to-noise ratio measurements have white rings after segmentation. The white rings designate the local area within which noise is measured. The resulting intensity values (g) and signal-to-noise ratio (h) are depicted as bar plots. Significantly brighter signals arise from compacted RCPs (21.9 intensity units; s.e.m. 0.39) as compared to regular RCPs (11.4 intensity units; s.e.m. 0.16) p < 0.001 [Mann-Whitney U test]). The signal-to-noise ratio for compacted RCPs was significantly higher at 14.6 dB (s.e.m. 0.03) as compared to 10.6 dB for regular RCPs (s.e.m. 0.05) p < 0.001 [Mann-Whitney U test]). Error bars are standard errors of the means. PLA was used with and without the compaction oligonucleotide, to detect progranulin in hippocampal tissue. Compacted RCPs (i) are visually compared to regular RCPs (j).

