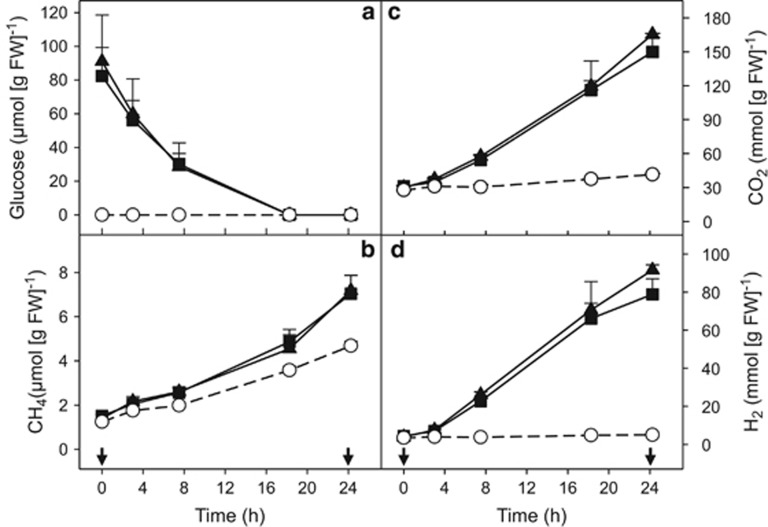
Figure 2.
Effect of supplemental glucose (a) on the production of CH4 (b), CO2 (c) and H2 (d) by the gut contents of E. eugeniae incubated under anoxic conditions. Symbols represent the mean of triplicate incubations, and error bars represent the s.d. Arrows indicate the time point at which the samples were taken for RNA-SIP analysis. Symbols: empty circles, control (no supplemental glucose); filled squares, [13C]-glucose treatments; filled triangles, [12C]-glucose treatments.

