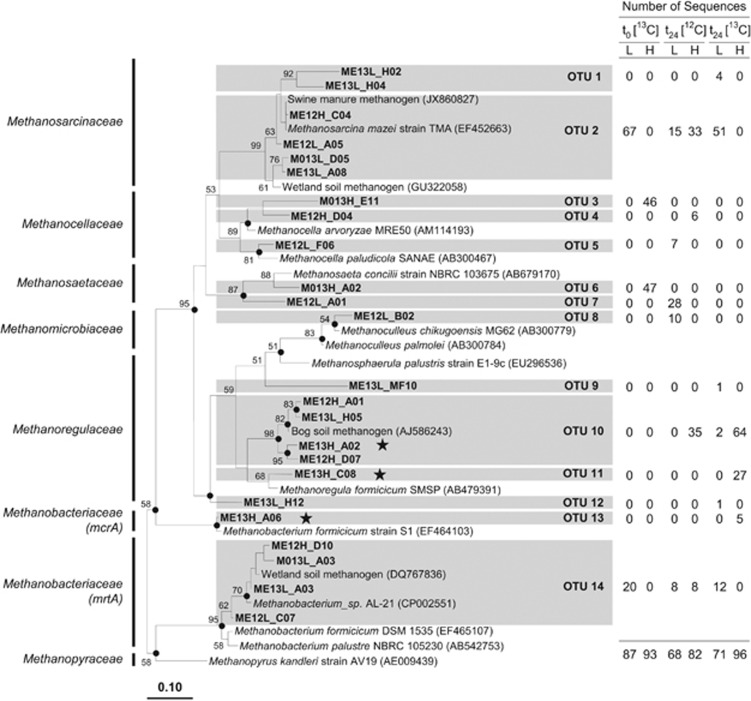
Figure 5.
Phylogenetic neighbor-joining tree of representative mcrA and mrtA amino-acid sequences of [13C]- and [12C]-glucose treatments. Numbers next to the branches represent the percentages of replicate trees (>50%) in which the associated taxa clustered together in the bootstrap test (10 000 bootstraps). Dots at nodes indicate the confirmation of the tree topology by maximum-parsimony and maximum-likelihood calculations with the same data set. Bar represents a 0.1 estimated change per amino acid. Accession numbers of reference sequences are in parentheses. Stars identify labeled mcrA and mrtA phylotypes. The table outlines the origin of sequences per species-level OTU (based on 85.7% gene sequence similarity; Hunger et al., 2011). Abbreviations in sequence identifier code: H, ‘heavy' fractions; L, ‘light' fractions; M0, methanogen sequence from sampling point t0 (that is, at the start of incubation); ME, methanogen sequence from sampling point t24 (that is, at 24 h of incubation); 13 and 12, [13C]- and [12C]-glucose treatments, respectively.

