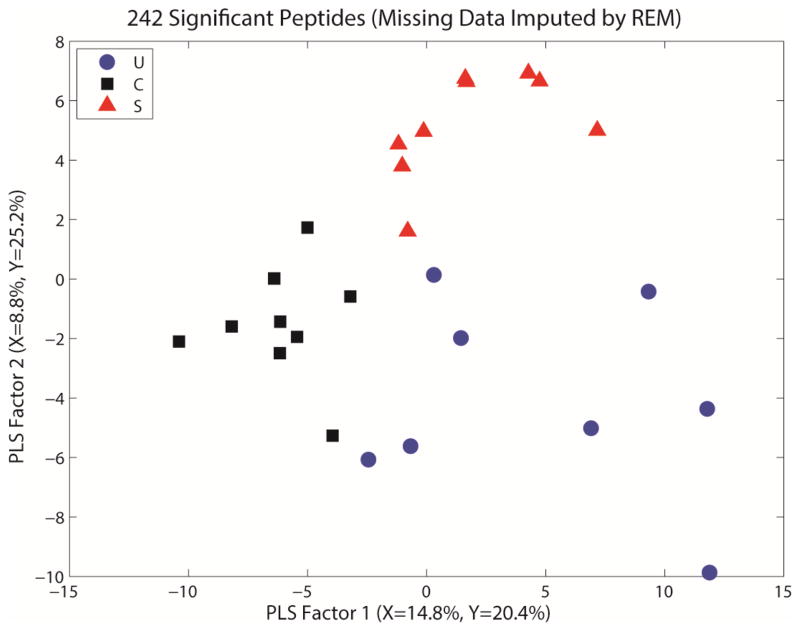
Figure 1.
PLS plot for the whole serum iTRAQ dataset with missing data for peptides imputed via regularized expectation maximization for analysis. This provides a visual representation of the separation among the groups via regression modeling, showing each phenotype clustering in a different area of the regression graph. S= stricturing Crohn’s, C= Crohn’s without stricture, U= ulcerative colitis.

