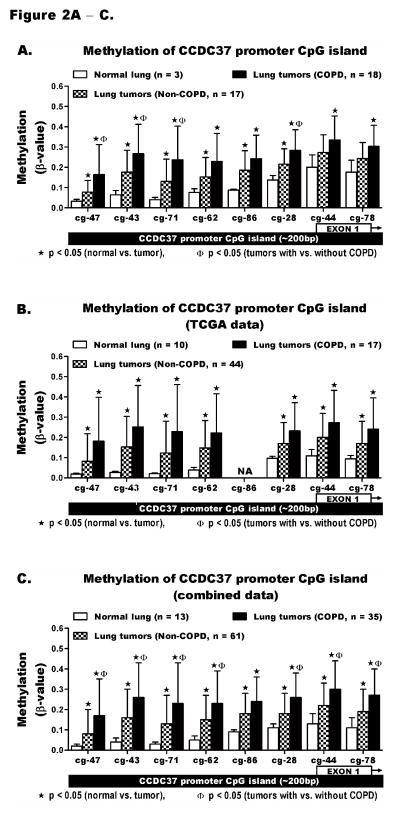
Figure 2. Quantitative methylation analysis of CCDC37 promoter CpG islands.
The HM450K array probes cg23816347, cg09686643, cg01815671, cg11229862, cg20952286, cg20312228, cg21109744, and cg00891278 interrogate the methylation levels across the promoter CpG island of CCDC37 (~200bp) targeting CpGs within the first exon and its upstream region. The methylation level (β-value) of each probe could range from β = 0 (no methylation) to β = 1 (100% methylation). Methylation was compared between normal lung and lung tumors from COPD and non-COPD cases using (A) our data, (B) TCGA data, and (C) a combination of the two data sets. The results are shown as mean ± standard deviation (SD) of β-values. The methylation levels among normal lung tissues were similarly low while tumors from both COPD and non-COPD cases showed large variation (depicted by the large SD). Details of the methylation analysis including the range and prevalence for methylation of each probe are shown in supplementary Tables S4, S6, and S7. Each probe IDs on the x-axes is shortened by replacing the first 6 numbers following cg by a hyphen (−).

