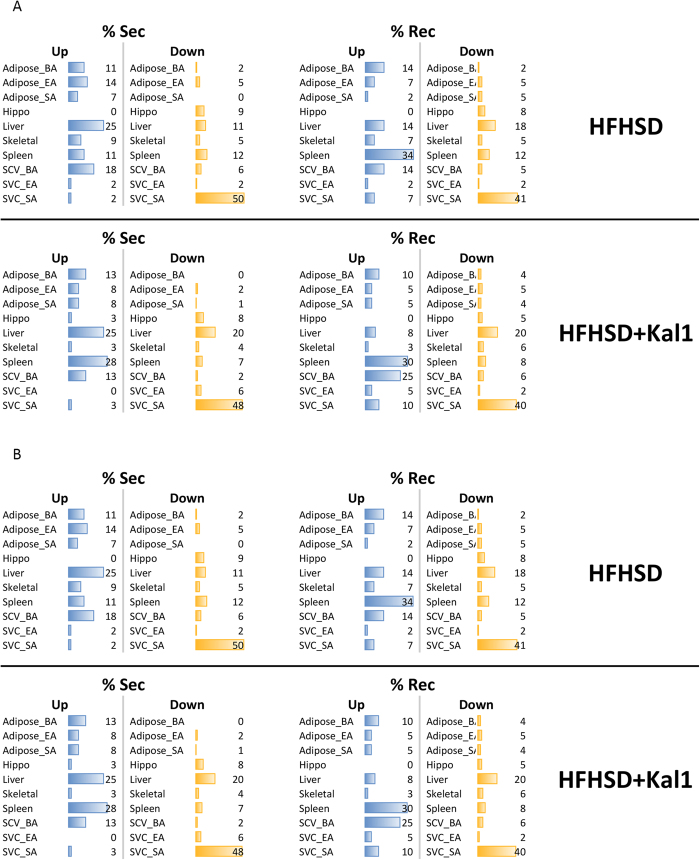
Figure 5. Dynamic tissue contribution.
Dynamic tissue contribution in the expression of receptor and secretory molecules was calculated as described in the methods. The percentage tissue-wise contribution is represented in 5A. Corresponding analysis for those interactions where trends were opposite between Res and Sec molecules is shown in 5B. Table S8 shows p-values for the statistical test comparing two population proportions.

