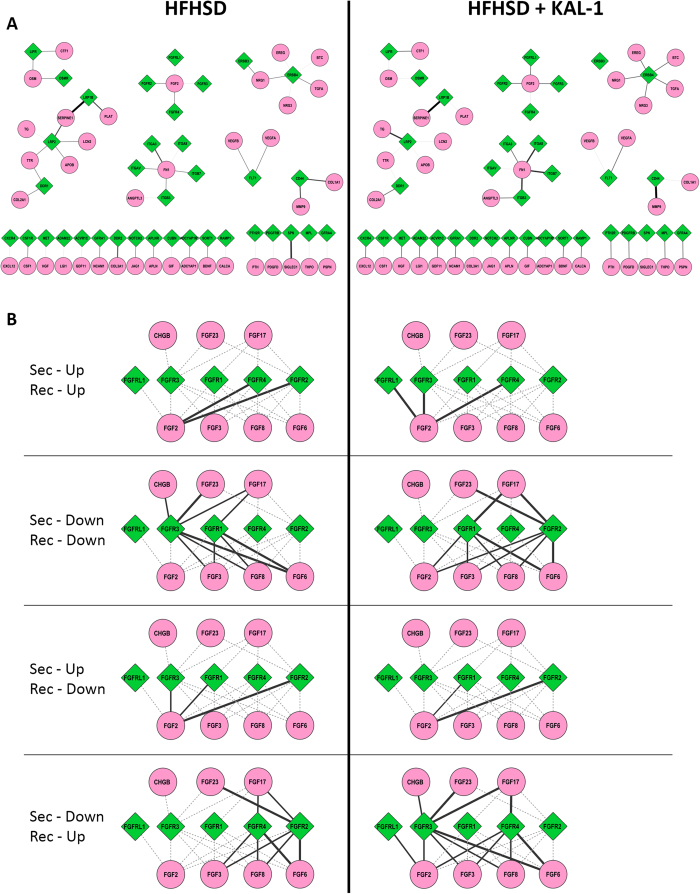
Figure 7. Dynamic molecular crosstalk.
The molecular interactions contributing to the tissue crosstalk are depicted in 7A. Diamonds (green) are receptors while circles (pink) are secreted molecules. Thickness of the connections corresponds to number of tissues showing interaction involving the pair of receptor and secreted molecules. Figure 7B combines dynamic cross talk for the FGF signaling modules across conditions where eithr or both of Res and Sec genes were up- or down-regulated. Here too diamonds (green) are receptors, circles are secreted molecules and thickness of connections correspond to number of tissues showing mentioned interaction pattern involving the pair.

