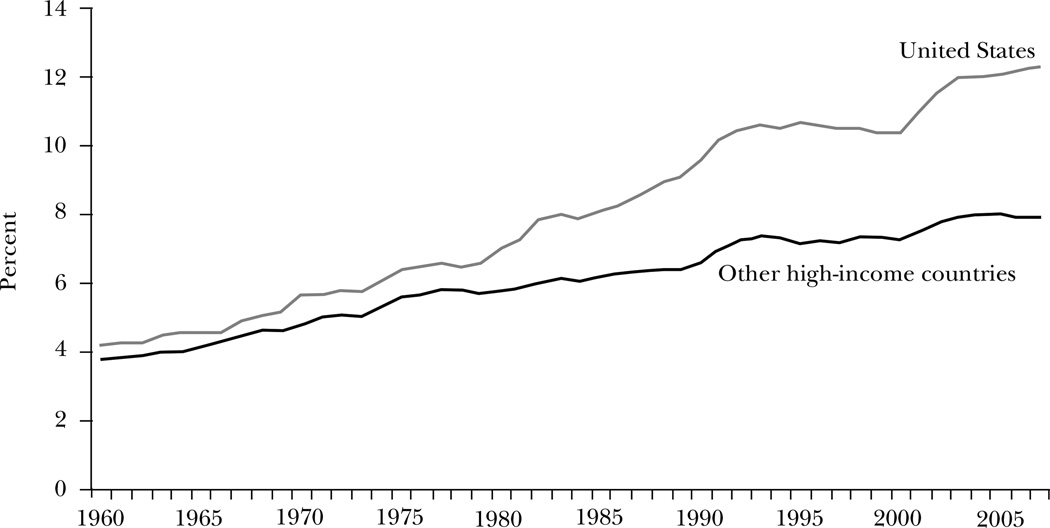
Figure 1. Acute Medical Spending as a Share of GDP, 1960–2007.
Source: Data are from OECD (2010).
Note: “Other high-income countries” refers to the unweighted average of spending as a share of GDP in 14 OECD countries: Australia, Austria, Canada, Finland, France, Germany, Italy, Japan, the Netherlands, Norway, Spain, Sweden, Switzerland, and the United Kingdom. Because of differences in the treatment of the residential component of long-term care services, we present data for acute care services only—generally hospitals, physicians, and prescription drugs. Some countries changed the methodology for estimating medical spending in various years. These breaks in the data were adjusted for increasing or decreasing spending in each year prior to the break, assuming that spending in the year of the break grew by the average of the year before and the year after the break.

