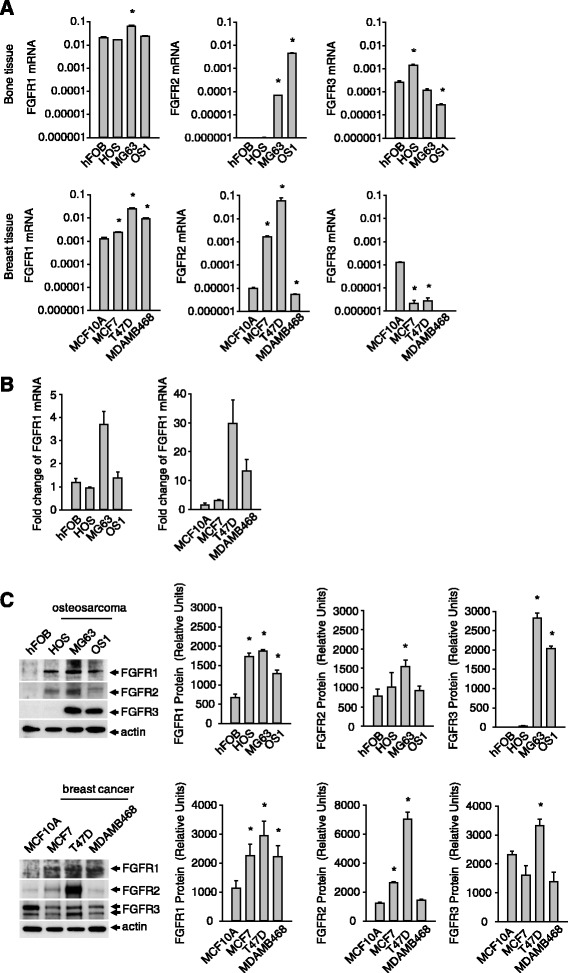
Fig. 1.

Expression of FGFR1 in cells from breast and bone tissue. a, FGFR mRNA transcript levels in normal and cancer cells. b, Fold change in FGFR mRNA based on expression in cancers cells relative to normal cells. c, FGFR protein levels in normal versus cancer cells. Results are from triplicate experiments and the Western blot is representative of the triplicates. (*p < 0.05)
