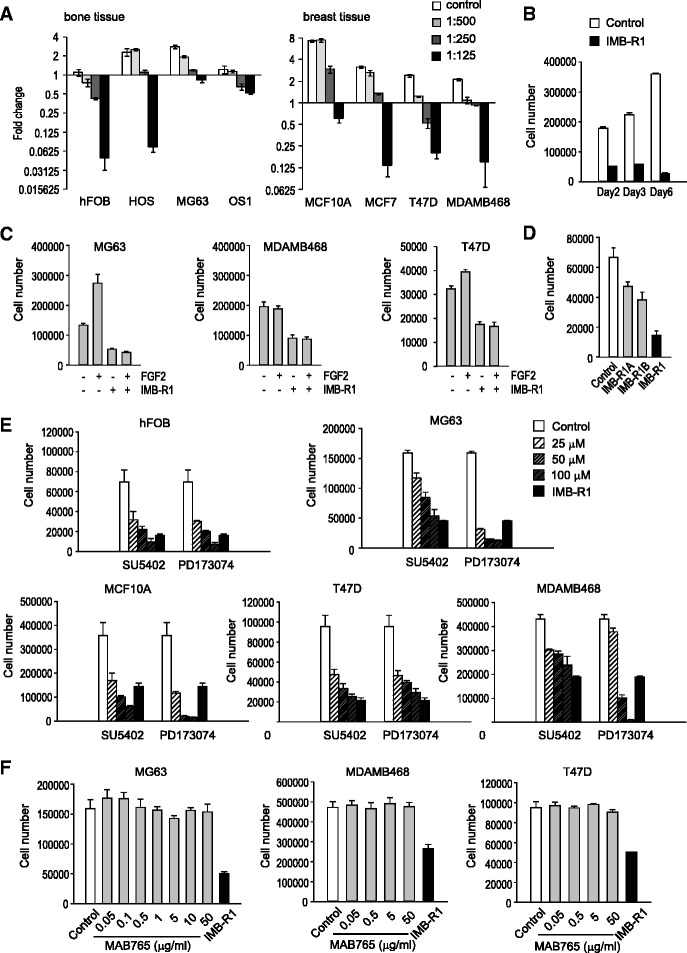
Fig. 3.

Effects of FGFR1 inhibitors on cell growth. a, Fold change in cell number 48 h after treatment with IMB-R1. b, Temporal change in MG63 cell number following treatment with IMB-R1 (1:250). c, Cell number following FGF2 treatment (20 ng/ml for MG63, 5 ng/ml for MDAMB468 and T47D) for 48 h. Cells were pre-treatment with IMB-R1 for 1 h before FGF2 treatment. d, Cell number (MG63) following 48 h treatment with IMB-R1 or antigen-purified IMB-R1. e, Cell numbers following 48 h treatment with varying doses of FGFR inhibitors. f, Cell numbers following 48 h treatment with the FGFR1 antibody (MAB765) at varying doses. Unless otherwise stated, IMB-R1 was applied at a dilution of 1:250. All experiments were performed in triplicate
